






连接与治理
接通你的系统、政策与知识,让 AI 在你的规则之内工作,而不是绕过它们。

/ Operations & Automation /
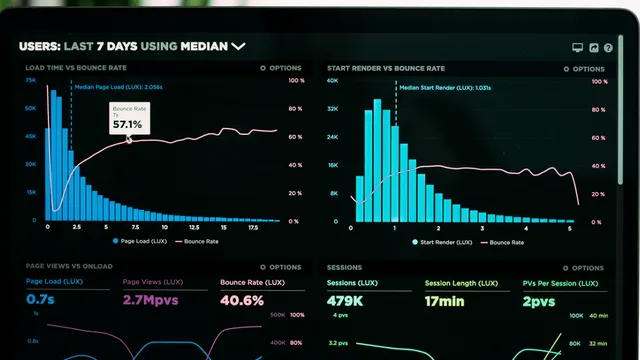
A unified intelligence layer that monitors, detects anomalies and surfaces the right information to the right people — before small problems become operational failures.
The problem
Operations data exists but is scattered. Getting a clear picture requires pulling from multiple systems manually.
Teams discover operational failures when customers complain or SLAs are already missed — not before.
Different teams use different metrics, different definitions and different tools. Alignment takes meetings, not data.
Signals fire across tools but no one owns the response. Teams debate responsibility while small issues become operational incidents.
How it works
接通你的系统、政策与知识,让 AI 在你的规则之内工作,而不是绕过它们。
让工作流上线:分流、起草、解决或升级,全程带完整上下文与审计追溯。
跟踪运营 KPI、质量与风险——再和你的团队一起调优剧本。
流程序列会适配你的工具、渠道与风险态势。
What's included
A governed layer across data, workflows, and handoffs—so teams ship safely and scale with metrics.
Connects to existing operational systems (TMS, WMS, ERP, CRM) without replacing them.
AI monitors operational patterns and flags deviations before they escalate.
Configurable alert rules by severity, team and channel (email, Slack, dashboard).
When something goes wrong, surfaces the most likely cause with supporting data.
Single view of operational health across teams, regions or business units.
Early indicators of demand spikes, resource constraints or service degradation.
Powered by Thinkia Synapse
Results
Results vary by systems landscape, data quality and operational complexity.
–70%
Earlier detection of operational anomalies vs. manual monitoring
Orientative — confirmed in discovery; depends on the starting point.
–50%
Time saved on manual operational reporting per week
Orientative — confirmed in discovery; depends on the starting point.
Single source
One operational view replacing 4+ disconnected dashboards.
Orientative — confirmed in discovery; depends on the starting point.
How we work
Week 1–2
KPIs, alerts, and drill-downs are agreed with ops leaders; data latency targets are explicit.
Week 3–5
ERP, MES, WMS, and tickets feed a governed model; ownership per metric is documented.
Week 6–9
Daily or weekly rhythms use the tower; decisions and actions are logged for feedback.
Week 10+
Plants, regions, or partners join with federated views; playbooks close recurring exceptions.
Plant heterogeneity and OT security constrain integrations; waves follow value and feasibility.
Go deeper
Ideas, trends, and tools to stay ahead
Get started
We start with a focused session—no commitment—to map constraints and a sensible path.